What it is for
This is a script that can be run to retrieve resource utilization statistics from a specified time range from a linux machine with sysstat installed. This script is shown at the bottom of this post.
How to use
You will first need to install sysstat on the machine you wish to gather performance statistics from. This can be retrieved here. You will also need to install openssh and gnuplot.
Seven arguments supplied (plus the command name itself):
./get_sysstats.sh dirname dayofmonth sthr stmin endhr endmin threadcount
|
- dirname – is created if it doesn’t already exist
- dayofmonth – day of the month (dd) with leading zero if necessary
- sthr – start hour of test period
- stmin – start minute of test period
- endhr – end hour of test period
- endmin – end minute of test period
- threadcount – Number of threads tested for this configuration if performance testing (used for presentation purposes only, use 1 by default)
- The dayofmonth has values ranging from 01 to 31
- The start and end hours have a value ranging from 00 to 23
- The start and end minutes have a value ranging from 00 to 59
To specify a start time of 9:05 and an end time of 10:05 on the
first day of this month you must say something like:
./[scriptName].sh dirname 01 09 05 10 05 1
|
- Change ‘appServer’, ‘username’ and ‘sar_logfile’ variables to the values of the machine you wish to capture statistics from
- After running the script you will be asked to enter your password for the set username 4 times. If you want to avoid doing this you can set up ssh and sshd for non-interactive login.
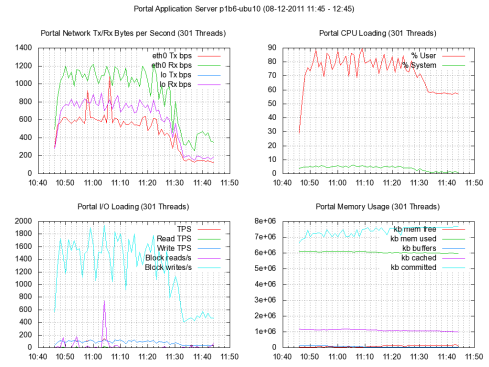
Example output
The Script
#!/bin/bash

# Seven arguments supplied (plus the command name itself):
# ./get_sysstats.sh dirname dayofmonth sthr stmin endhr endmin threadcount
#
# dirname - is created if it doesn't already exist
# dayofmonth - day of the month (dd) with leading zero if necessary
# sthr - start hour of test period
# stmin - start minute of test period
# endhr - end hour of test period
# endmin - end minute of test period
# threadcount - Number of thread (pairs) tested for this configuration
#
# The dayofmonth has values ranging from 01 to 31
# The start and end hours have a value ranging from 00 to 23
# The start and end minutes have a value ranging from 00 to 59
#
# To specify a start time of 9:05 and an end time of 10:05 on the
# first day of this month you must say something like:
#
# ./get_sysstats.sh dirname 01 09 05 10 05 1
#
# Change 'appServer', 'username' and 'sar_logfile' variables to required values
#
#

E_BADARGS=65

if [ $# -ne 7 ]
then
  echo "Usage: `basename $0` dirname dayofmonth sthr stmin endhr endmin threadcount"
  echo ""
  echo "The time specified is a local time but the date is effectively UTC."
  echo "This means that depending on the time of day if you are collecting"
  echo "today's statistics you may need to specify the day of the month as"
  echo "today or yesterday based on the time of day."
  echo ""
  echo "To get an idea of the date you'll need to specify use date -u."
  exit $E_BADARGS
fi

destdir=$1
dayofmonth=$2
sthr=$3
stmin=$4
endhr=$5
endmin=$6

sth=$sthr
stm=$stmin
endh=$endhr
endm=$endmin
threadcount=$7

if [ `echo $sthr|cut -b 1` == 0 ]; then sth=`echo $sthr|cut -b 2`; fi
if [ `echo $endhr|cut -b 1` == 0 ]; then endh=`echo $endhr|cut -b 2`; fi
if [ `echo $stmin|cut -b 1` == 0 ]; then stm=`echo $stmin|cut -b 2`; fi
if [ `echo $endmin|cut -b 1` == 0 ]; then endm=`echo $endmin|cut -b 2`; fi

threadcount=$7
xinterval=$(((($endh - $sth)*3600+($endm-$stm)*60)/6))
# The date of test is concatenated to the day of month to create the test date for which data is to be collected
dateoftest=`date +%m-%Y`
fullmachinename=`uname -n`
nodename=${fullmachinename%}
appServer=p5b6-ubu10 # Set your applications server here
username=admin # Set your username here

if [ ! -d $destdir ]
then
  echo "Creating directory: ${destdir}"
  mkdir -p $destdir
fi

# Centos
#sar_logfile=/var/log/sa/sa${dayofmonth}

# Ubuntu
sar_logfile=/var/log/sysstat/sa${dayofmonth} # Set your log file directory here

timestamp=${dayofmonth}-${dateoftest}_${sthr}${stmin}-${endhr}${endmin}
cpu_report=${destdir}/${appServer}_cpu_${timestamp}.csv
disk_report=${destdir}/${appServer}_dsk_${timestamp}.csv
memory_report=${destdir}/${appServer}_mem_${timestamp}.csv
network_report=${destdir}/${appServer}_net_${timestamp}.csv
echo "date of test: ${dayofmonth}-${dateoftest}"
echo "nodename: ${nodename}"
echo "Start time: ${sthr}:${stmin}"
echo "End time: ${endhr}:${endmin}"

# Get statistics application server

# sar stats for CPU
ssh ${username}@${appServer} sadf -D -s ${sthr}:${stmin}:00 -e ${endhr}:${endmin}:00 -- -u ${sar_logfile} > ${cpu_report}
# sar stats for disk I/O
ssh ${username}@${appServer} sadf -D -s ${sthr}:${stmin}:00 -e ${endhr}:${endmin}:00 -- -b ${sar_logfile} > ${disk_report}
# sar stats for memory
ssh ${username}@${appServer} sadf -D -s ${sthr}:${stmin}:00 -e ${endhr}:${endmin}:00 -- -r ${sar_logfile} > ${memory_report}
# sar stats for network
ssh ${username}@${appServer} sadf -D -s ${sthr}:${stmin}:00 -e ${endhr}:${endmin}:00 -- -n DEV ${sar_logfile} > ${network_report}

# Separate the ethernet and loopback interface results from the network statistics file
ethnet_report=${destdir}/${appServer}_ethnet_${dayofmonth}-${dateoftest}_${sthr}${stmin}-${endhr}${endmin}.csv
lonet_report=${destdir}/${appServer}_lonet_${dayofmonth}-${dateoftest}_${sthr}${stmin}-${endhr}${endmin}.csv
grep [^p]eth0 ${network_report} > ${ethnet_report}
grep lo ${network_report} > ${lonet_report}

# Remove first line from cpu, mem and disk statistics files
sed --in-place=.orig -e '1d' ${cpu_report}
sed --in-place=.orig -e '1d' ${memory_report}
sed --in-place=.orig -e '1d' ${disk_report}

# Create a configuration file to be used to drive gnuplot using a here-document
(
cat <<EOF
# Gnuplot configuration for performance graphs
#
# Render Performance graphs
# Network
#
set datafile separator ";"
set terminal png size 1024,768
set out "${destdir}/${threadcount}tp-application-performance-${dayofmonth}-${dateoftest}-${sthr}${stmin}-${endhr}${endmin}.png"
set multiplot layout 2,2 title "Application Server ${appServer} (${dayofmonth}-${dateoftest} ${sthr}:${stmin} - ${endhr}:${endmin})"
set title "Network Tx/Rx Bytes per Second (${threadcount} Threads)"
set grid mxtics
set grid xtics
set grid mytics
set grid ytics
set xdata time
set lmargin 8
set rmargin 3
set timefmt "%s"
set format x "%l:%M"
set xtics $xinterval
plot "${destdir}/${appServer}_ethnet_${dayofmonth}-${dateoftest}_${sthr}${stmin}-${endhr}${endmin}.csv" using 3:8 title "eth0 Tx bps" with lines, \
     "${destdir}/${appServer}_ethnet_${dayofmonth}-${dateoftest}_${sthr}${stmin}-${endhr}${endmin}.csv" using 3:7 title "eth0 Rx bps" with lines, \
     "${destdir}/${appServer}_lonet_${dayofmonth}-${dateoftest}_${sthr}${stmin}-${endhr}${endmin}.csv" using 3:8 title "lo Tx bps" with lines, \
     "${destdir}/${appServer}_lonet_${dayofmonth}-${dateoftest}_${sthr}${stmin}-${endhr}${endmin}.csv" using 3:7 title "lo Rx bps" with lines

# CPU
set title "CPU Loading (${threadcount} Threads)"
plot "${cpu_report}" using 3:5 title "% User" with lines, \
     "${cpu_report}" using 3:7 title "% System" with lines

# Disk I/O
set title "I/O Loading (${threadcount} Threads)"
plot "${disk_report}" using 3:4 title "TPS" with lines, \
     "${disk_report}" using 3:5 title "Read TPS" with lines, \
     "${disk_report}" using 3:6 title "Write TPS" with lines, \
     "${disk_report}" using 3:7 title "Block reads/s" with lines, \
     "${disk_report}" using 3:8 title "Block writes/s" with lines

# Memory
set title "Memory Usage (${threadcount} Threads)"
plot "${memory_report}" using 3:4 title "kb mem free" with lines, \
     "${memory_report}" using 3:5 title "kb mem used" with lines, \
     "${memory_report}" using 3:7 title "kb buffers" with lines, \
     "${memory_report}" using 3:8 title "kb cached" with lines, \
     "${memory_report}" using 3:9 title "kb committed" with lines
unset multiplot


EOF
) > performancegraphs.gp
# End of here-document

gnuplot performancegraphs.gp

rm performancegraphs.gp
Tags: bash, linux


