Introduction
Thread and heap dumps can be used to analyse JVM concurrency and performance issues
Thread dump:
A file dump that shows all live threads currently living in the JVM
Heap dump:
A file dump that physically contains all objects on the JVM heap (usually large files as it is a snapshot of the heap itself)
Taking Heap/Thread dumps remotely using MBean Toolkit
The jar file at the github repository https://github.com/techshare1337/MBeanToolkit contains a jar file which is an app that can be launched as a normal executable. This app will allow you to take heap/thread dumps from your local PC by connecting to a JVM on another machine. In order to connect to a JVM on another machine the following flags need to be set on that JVM which can be done by following the guide below ‘Extracting the heap dump from the server’. The source code for this project can be checked out at https://github.com/techshare1337/MBeanToolkit.
-Dcom.sun.management.jmxremote # allow remote jmx connections -Dcom.sun.management.jmxremote.port=8802 # port to connect on (doesn't have to be 8802) -Dcom.sun.management.jmxremote.ssl=false # disable ssl authentication -Dcom.sun.management.jmxremote.authenticate=false # set authenticate to false -Djava.rmi.server.hostname=volrd10.int.corp.sun # set hostname to hostname or ip of machine that JVM is hosted on |
- Connect to JVM using [hostname]:[port] e.g. ‘voldrd10:8802’ from example above

- To take a heap dump
- Give the heap dump a filename and click heapdump. Heap dump should be named with filename + timestamp details and located in JVM directory on the remote server depending on JVM flags for heap dump output
- To take a thread dump
- Click thread dump. Application should collect dump info returned and output to file in same directory as the toolkit
Using the scheduler:
The scheduler can be used to take dumps at a set time, on a set repeation period and for a set duration. This is useful for diagnosing issues that can occur from the build up of something overtime.
To do this, check the scheduler checkbox and enter in the start delay (time to wait for a dump to be taken), repeat period (time to wait before taking another dump), duration (period to keep taking dumps for.
E.g. start delay=3600, repeat every=60, duration of=1800
Will wait for 1 hour to take a dump and repeat taking a dump every minute after this for half an hour.
Finally click the dump button to start the scheduler.

Extracting the Heap Dump from the server
1. On the machine with said heap dump, login using PuTTY and use the command
sudo su - [superuser] |
this will then allow you to modify permissions which you will need to apply to modify and extract files. The following command will give you full permissions on the ‘wsdev’ group which you should be added to from the previous step and applies to the directory where heap dumps and settings for them are set.
chmod -Rf 774 /apps/tc6 |
Setting the flags for remote JMX connections:
1. Using WinSCP, go to the directory /apps/tc6/[nameOfAppForHeapDump]/script
2. Modify flags to be as shown in the tutorial above in the file which contains flags or the config. The one I have noticed that always needs to be changed (from true to false) is
-Dcom.sun.management.jmxremote.authenticate=false |
Also, if you want a heap dump to be invoked on out of memory errors add the following flag to the file
-XX:+HeapDumpOnOutOfMemoryError" |
so would be
CATALINA_OPTS="$CATALINA_OPTS -XX:+HeapDumpOnOutOfMemoryError" |
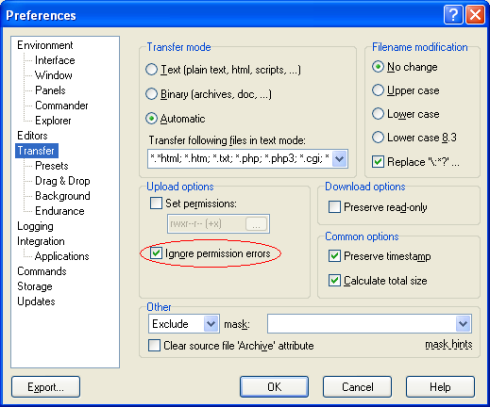
You may get an error that reads something along the lines of ‘timestamp cannot be modified’ after saving, just skip this message. Alternatively go to WinSCP preferences and check the box for ‘Ignore permission errors’ to suppress this warning from now on as shown below.

You must now stop and start the jvm again to apply the changes.
Extracting heap dumps
Drag and drop the heap dump file to your local pc which should be able to be done if you’ve set the permissions correctly


