
Eclipse Memory Analyzer
Introduction
Eclipse Memory Analyzer is used to analyze heap dumps taken from the targetted JVM. Eclipse Memory Analyzer is a useful tool to identify potential memory leaks and areas of the application which are memory intensive.
How to use
- Extract the folder contained in downloaded zip file
- Open up the file mat/MemoryAnalyzer.ini in a text editor and change ‘-vmargs-Xmx1024’ to the desired value which depends on how large the heap you intend to open is. E.g. if your max heap size is set to 2048mb you should change the value to ‘-vmargs-Xmx2048’. Although you might have to allow for some leeway (-vmargs-Xmx2500) as this dumps can usually go over the max limit when an out of memory error occurs
- Start the application (mat/MemoryAnalyzer.exe)
- Go to file > open heap dump. Eclipse memory analyzer recognizes the extension .hprof as heap dumps so if your dump does not have this extension, select All Files on the dropdown
- Open up the heap dump, you will see a dialog that shows the progress of the opening of the heap dump, this may take a while depending on how large your heap dump is
- After it has been opened you will see a dialog like this:
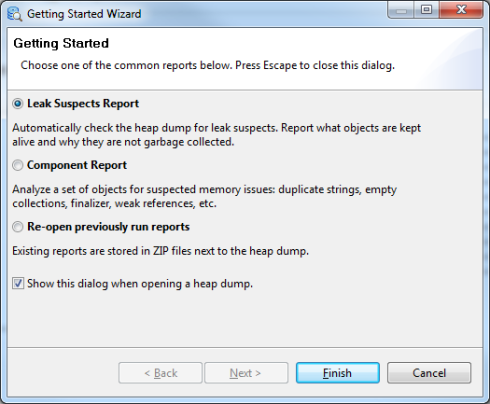
- Choosing the option Leak Suspects Report will give you an overview of what objects occupy a large portion of the heap so this is a good place to start. You will get something that looks like the following. As shown in the screenshot below we have a high level picture of potential memory leaks or inefficient memory usage due to instances of “org.apache.tomcat.util.threads.TaskThread”. It appears these instances occupy ~45% of the heap:


Another useful thing you can do to drill down further to the root cause of this problem is to click the icon ‘OQL’ as shown below.

This will open up a new tab which you can then use to make queries on the problem classes. As shown below, the query selects all objects of the specified class and displays them in a tree-like structure. Clicking on the heading ‘Retained Heap’ will allow you to sort by descending usage of memory which is probably a more useful sequence to view these objects in. You can then expand the nodes to gain further insight to where most of the memory has been allocated. The panel on the left-hand side is useful as it shows the values of each of the object fields.


Useful content and awesome design you got here! I want to thank you for sharing your solutions and taking the time into the stuff you publish! Sublime work!